Understanding How Misinformation Spreads

Building an analytical workflow that turned large volumes of news reporting into structured evidence, spatial patterns and clearer insight for an academic research team studying news diffusion and misinformation surrounding the 2017 Manchester and London terrorism incidents.

News diffusion data visualisation
Turned high-volume news reporting into multi-level visualisations that made patterns, concentrations and changes in information activity easier to identify.
Automated news data pipeline
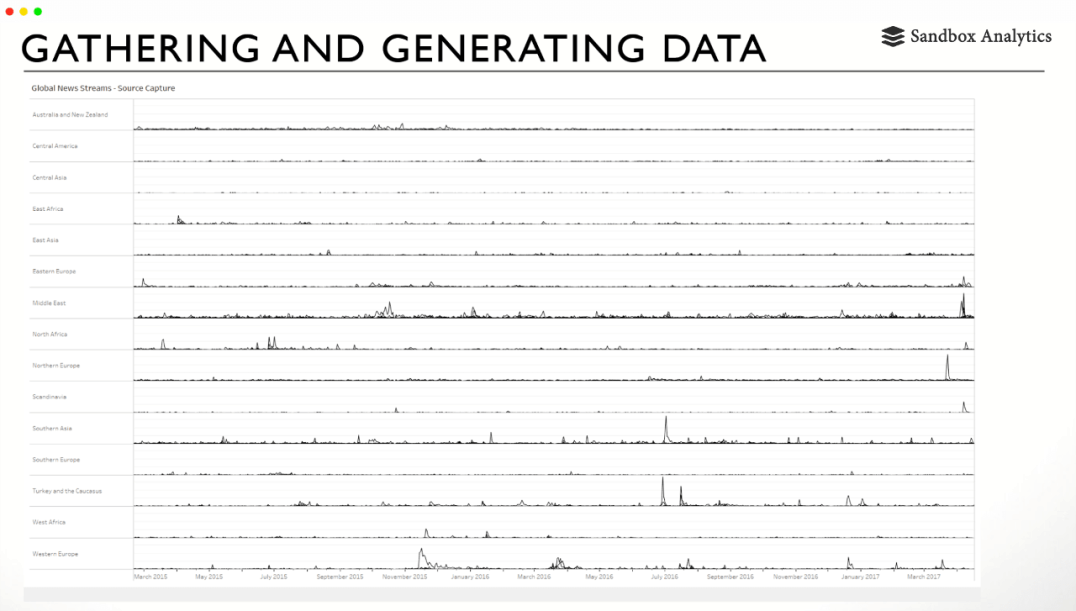
Automated the collection and processing of information feeds into a structured database, allowing researchers to spend more time interpreting the evidence rather than assembling it.
Geospatial news analysis
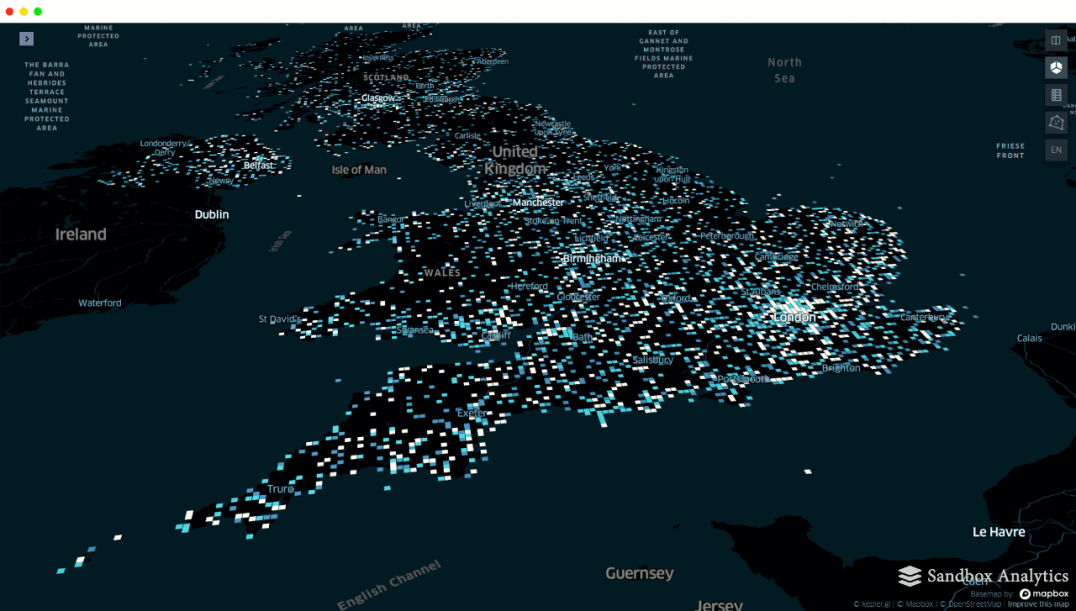
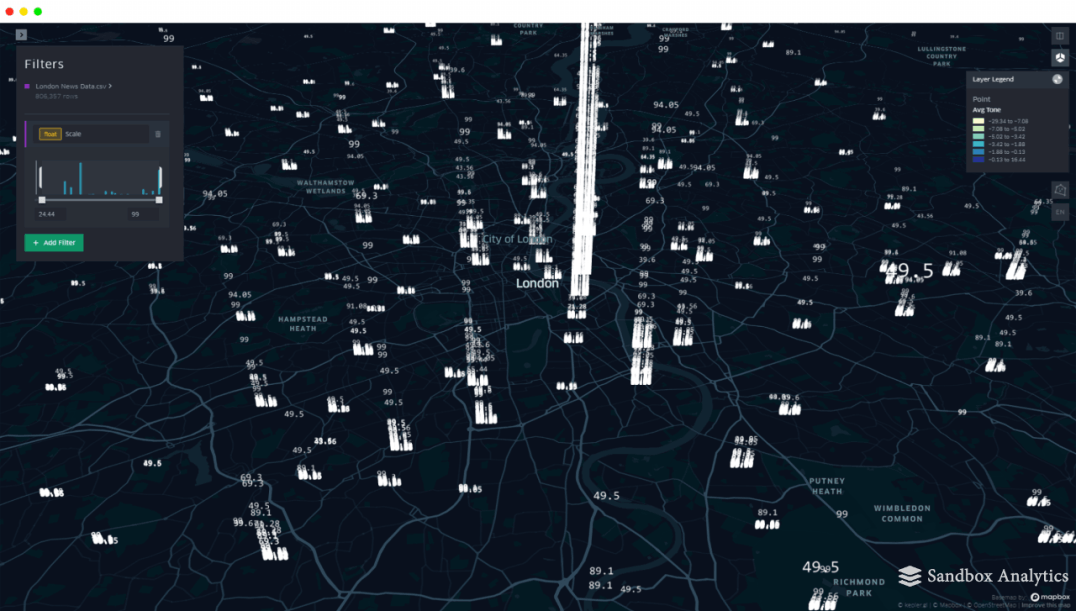
Added location to the analysis by mapping geo-coded news reports, revealing spatial relationships and helping the research team explore how information moved across different places.
News diffusion analytical dashboard
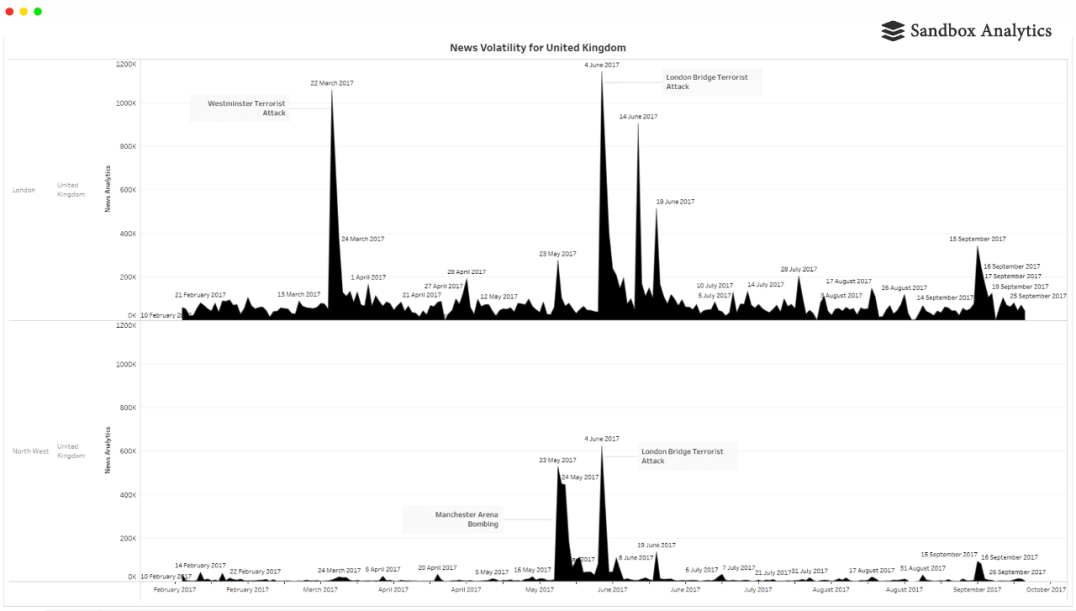
Built analytical views to compare the timing and volume of reporting, helping surface unusual patterns in news diffusion and potential misinformation around major incidents.

Decision Outcome

The project converted a fragmented stream of unstructured data into a repeatable analytical system. Automated data collection, geospatial analysis and visualisation gave the research team a stronger evidence base for understanding how information spread, where unusual patterns emerged and how narratives changed following major incidents. The resulting analysis was designed to support both research and policy thinking around misinformation, information resilience and the response to rapidly evolving events.
See More Selected Work